NASA's Imagine the Universe.
This page is a work in progress as the market and regulations are changing rapidly...
Regulations | Study Aids | Charts/Airspace | Weather | Imagery | Drones/Sensors | Software | Class Presentations | References
FAA Drone Zone - Drone Registration and
Authorizations
FAA -Unmanned Aircraft Systems
Part 107
Part 61
Educational
Users
TRUST (test for recreational flyers)
Take the TRUST test at: Academy of Model Aeronautics
The Legal Drone (study site)
YouTube Video
Part 107
FAA Study Guide (PDF)
FAA Sample Questions
FAA Pilots Handbook
UAS Policy Library
Advisory Circular 107-2
AI Institute for Next-Generation Food Systems Drone Curriculum
VFR Charts
Airport Facilities Directory
Airspace Map
TFR Maps
Notams
Airspace
Authorization
UAS Facility Maps
Airnav (Airport info)
UOA Video
Aviation Weather
ASOS/AWOS (in A/FD)•
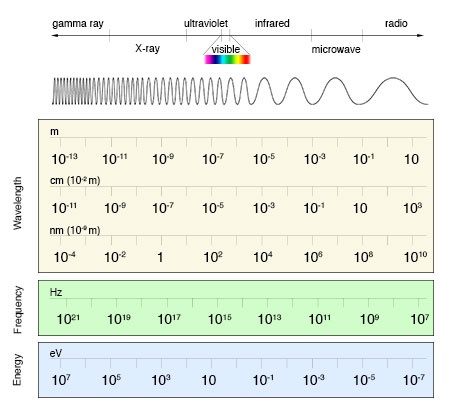
Electromagnetic Spectrum
NASA's Imagine the Universe.
| Region Name | Wavelength | Comments |
| X-ray | 0.03 to 30 nanometers | Entirely absorbed by the Earth's atmosphere and not available for remote sensing. |
| Ultraviolet | 0.03 to 0.4 micrometers | Wavelengths from 0.03 to 0.3 micrometers absorbed by ozone in the Earth's atmosphere. |
| Photographic Ultraviolet | 0.3 to 0.4 micrometers | Available for remote sensing the Earth. Can be imaged with cameras and sensors. |
| Visible | 0.4 to 0.7 micrometers | Available for remote sensing the Earth. Can be imaged with cameras and sensors. |
| Near and Mid Infrared | 0.7 to 3.0 micrometers | Available for remote sensing the Earth. Can be imaged with cameras and sensors. |
| Thermal Infrared | <0.7 to 3.0 micrometers | Available for remote sensing the Earth. This wavelength cannot be captured by film cameras. Sensors are used to image this wavelength band |
| Micowave or Radar | 0.1 to 100 centimeters | Longer wavelengths of this band can pass through clouds, fog, and rain. Images using this band can be made with sensors that actively emit microwaves. |
http://www.oneonta.edu/faculty/baumanpr/geosat2/RS-Introduction/RS-Introduction.html
Near-infrared spectroscopy - Wikipedia
Green Difference
Vegetation Index (GDVI)
Normalized difference vegetation index (NDVI)
Best Drones For Agriculture 2017- The Ultimate Buyer's Guide
AgEagle
SenseFly eBee
PrecisionHawk
HoneyComb
Sentera
DJI
Aerial Technology
International
Dronefly
SLANTRANGE - Multispectral Sensors and
Analytics for Agriculture Drones
FLIR -
Thermal Sensors
Calculating Ground Sampling Distance
GSD Calculator
Drone & UAV Mapping Software -
DroneDeploy
Dronelink
DJI GS Pro
WebODM (Image Processing) (Online
Version)
DroneMapper
Pix4D
Precision
Analytics
QGIS (GIS)
ESRI
(GIS)
GDVI
GDVI - Corn Nitrogen Requirements
NDVI - Cotton Ground Cover
Thermal IR - Water Status in Tree Fruit
Imagery
for Weed Management
Green-Red Vegetation Index for Vegetation Phenology
Mapping crop water stress index in a
‘Pinot-noir’vineyard
REMOTE SENSING OF VEGETATION FROM UAV PLATFORMS
Assessment of vineyard water status variability
Crop water stress mapping for
site-specific irrigation
Detect corn, soybean crop stress with thermal images and maps
Precision
Ag Thermal Infrared - Cornerstone Mapping
Multispectral Imaging Camera Drones In Farming Yield Big Benefits
Applications of Thermal Imaging in
Agriculture